

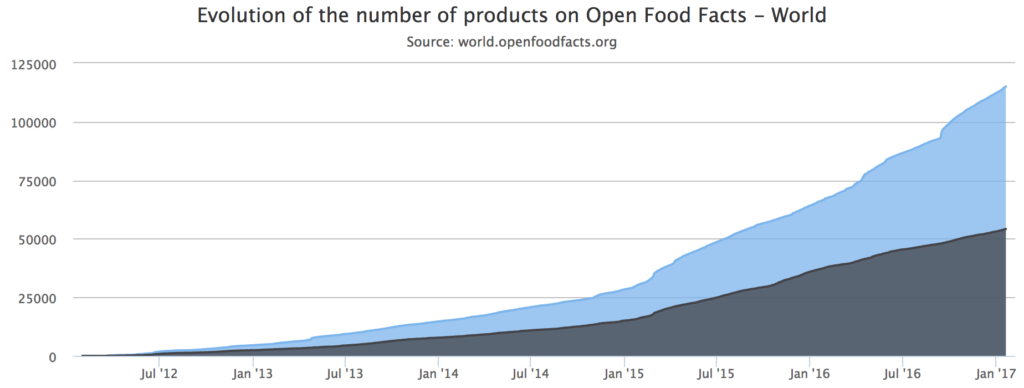
The data growth in the Open Food Facts database has been steadily growing, or rather, the growth has been steadily accelerating. After celebrating the 100K mark in October, OFF contributors didn’t just eat Christmas puddings, they also added a whopping 15k products.

However, the FR section of Open Food Facts still represents over two thirds of the data.
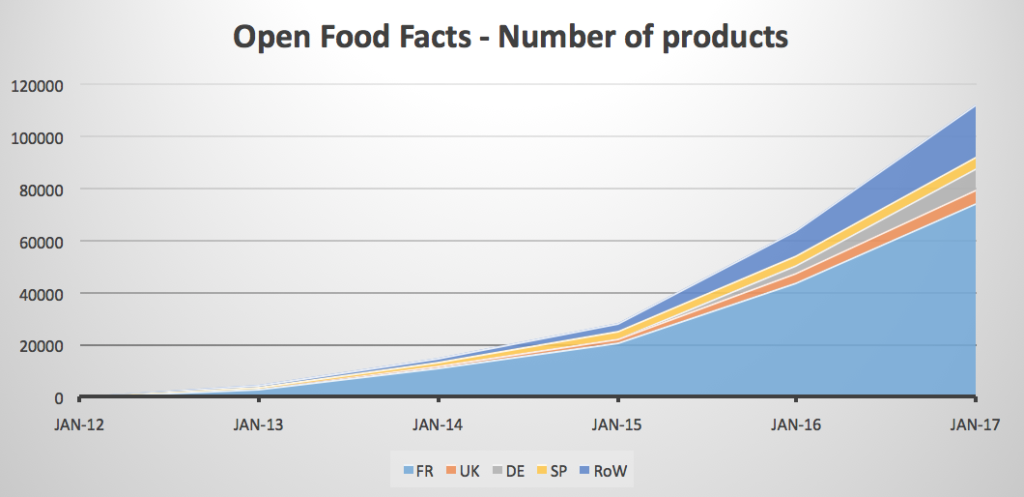

But, on the bright side, we can notice that whilst the data for FR is still fast growing, other countries’ data is picking up, most notably Germany which has seen its data increase by 2.5 folds – from less than 3k to close to 8k in just a year! The activity in other countries has been increasing too, with their share rising to 17.6% in 2017. I am not sure what 2017 is going to bring to us, but I know it will be good. As we doubled the number of products in 2016, should we see over 200k products in January 2018, or, if the accelerating trend carries on, perhaps over 300, 400 or even 500k? Up to us to make it happen.
By the way, dear fellow UK residents, we need to catch-up… Our share has been going down. We can’t let that happen 😉
Here is the raw data:
| Year | World | FR | FR% | UK | UK% | DE | DE% | SP | SP% | RoW | Row% |
|---|---|---|---|---|---|---|---|---|---|---|---|
| Jan-12 | 1 | 1 | 100.0% | 0 | 0.0% | 0 | 0.0% | 0 | 0.0% | 0 | 0.0% |
| Jan-13 | 4527 | 3269 | 72.2% | 22 | 0.5% | 40 | 0.9% | 834 | 18.4% | 362 | 8.0% |
| Jan-14 | 14740 | 11685 | 79.3% | 131 | 0.9% | 156 | 1.1% | 1619 | 11.0% | 1149 | 7.8% |
| Jan-15 | 28419 | 20858 | 73.4% | 1560 | 5.5% | 331 | 1.2% | 2527 | 8.9% | 3143 | 11.1% |
| Jan-16 | 64145 | 43856 | 68.4% | 3876 | 6.0% | 2914 | 4.5% | 3545 | 5.5% | 9954 | 15.5% |
| Jan-17 | 112263 | 74849 | 66.7% | 5102 | 4.5% | 7736 | 6.9% | 4774 | 4.3% | 19802 | 17.6% |
Nice analysis Benoît. I hadn’t seen it. Can you share it in Slack ?